
In the vast world of Open-Source Intelligence tools, there stands a feature that might just change the way you perceive your online research. The OSINT-tool’s “History Graph” functionality is here to revolutionize your investigative journeys, and in this blog post, we’ll delve deep into understanding its workings, its undeniable advantages, and who stands to benefit the most.
What is the History Graph Functionality?
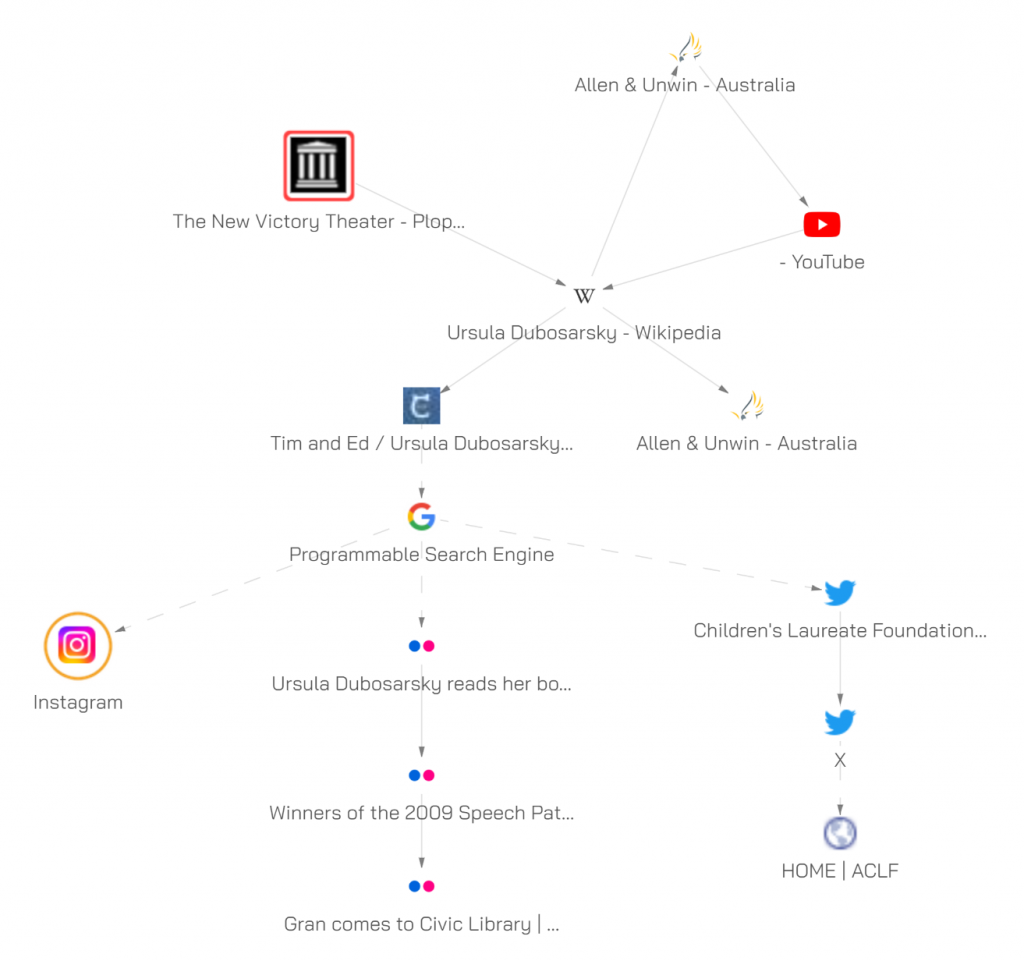
At its core, the History Graph is a visual representation of your online exploration. Imagine a flowchart or a roadmap, detailing each twist, turn, backtrack, and leap you make across the web. Each website you visit is mapped as a node, with lines connecting them in the sequence you’ve travelled. Not just a bookmark list or a history tab, the History Graph maintains the context, showing not just where you’ve been, but also how and when you got there.
It’s like having a breadcrumb trail for the vast digital forest we navigate every day, ensuring that you never lose track of that one crucial webpage or that important piece of information you stumbled upon.
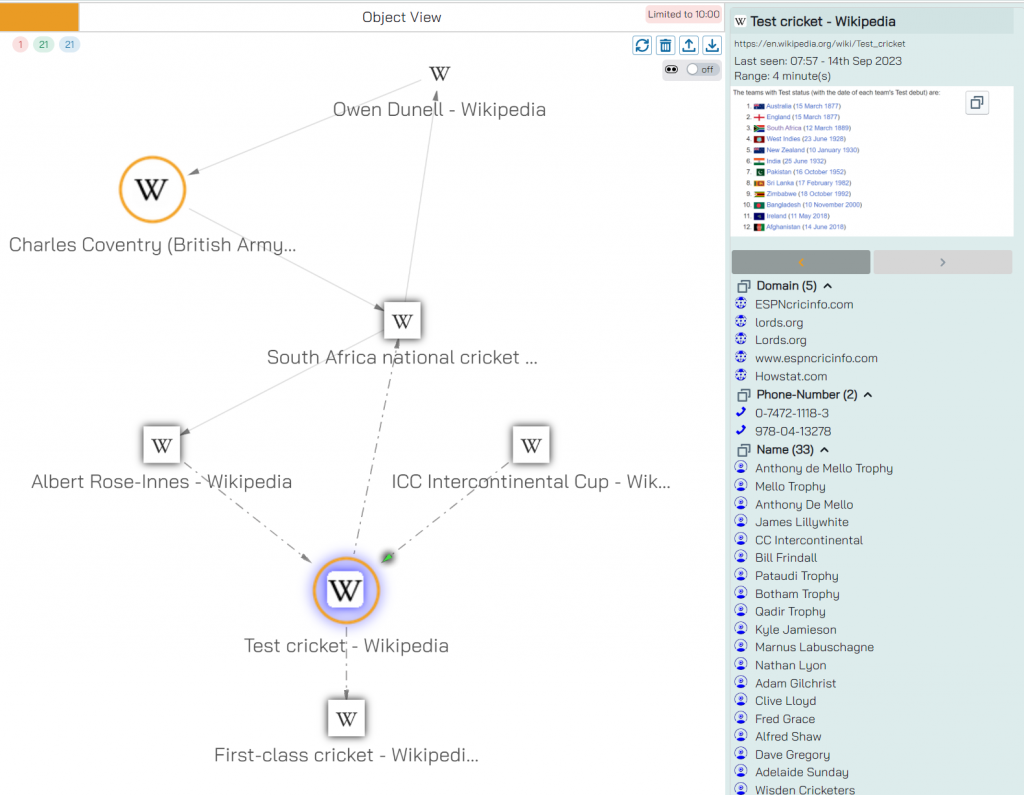
But there’s more to it than just mapping out sites. It provides tools for users to indicate the importance of a particular website. Bookmarking and taking multiple screenshots are two of these tools. The latter, especially, adds an intuitive touch; when users feel the need to take multiple snapshots, it’s an implicit indicator of the website’s importance.
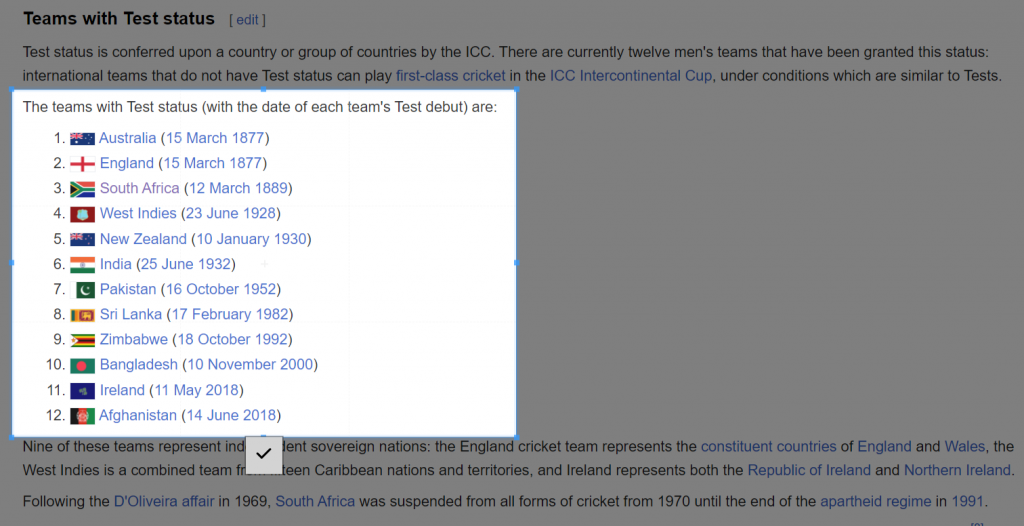
Furthermore, you can navigate this graph with ease. By hovering over any node, users can get a glimpse of the last screenshot taken from that site. This acts as a visual reminder of what the site contained, aiding users in quickly identifying and recalling vital information. And with the temporal view, it’s effortless to see when you last visited a particular site.
Why the History Graph Functionality Matters
- Retrace your steps. One of the primary advantages of the History Graph is its ability to help users retrace their steps. Too often, analysts, researchers, or curious explorers find themselves unable to backtrack to a significant piece of information. By visually representing the path, the History Graph mitigates this problem.
- Comprehensive Overview: Instead of scrolling through endless lists in your browser’s history, you get an organized, visual snapshot of your journey. This can make revisiting sites or understanding your exploration patterns far easier.
- Contextual Clarity: The sequential presentation ensures you understand the context of your visits. For instance, knowing which article led you to another can often provide context that’s lost in traditional browser histories.
- Efficiency and Productivity: It reduces the time spent retracing steps or looking for that elusive website you remember visiting but can’t quite find.
- Record Keeping: For professionals who need accurate and comprehensive documentation of their online activities, be it for research, legal matters, or investigations, the History Graph is a game-changer.
Who Stands to Benefit?
- Cybersecurity Enthusiasts: Dive deep into your research and retrace your steps with precision.
- Digital Forensic Experts: Visual evidence of web journeys can be a potent tool in cracking cases.
- Journalists: Document your investigative journey online, ensuring every source can be revisited.
- Researchers and Academics: Say goodbye to lost sources and hours of trying to rediscover that one webpage.
- Market Analysts: Keep tabs on your competitor analysis and industry trend tracking.
- Law Enforcement Officials: A tool in online investigations to map out a suspect’s or victim’s digital journey.
- Legal Professionals: Every piece of online evidence, every source, and every reference, right at your fingertips.
- Web Developers, Designers, Product Managers, and UX Designers: Inspiration, benchmarking, or competitor analysis has never been this organized.
- Private Investigators: The internet is your playground, and now you have a map.
In conclusion, the History Graph functionality of the OSINT-tool isn’t just a feature; it’s a transformative experience for anyone who spends a significant amount of time researching online. It’s about optimizing your workflow, understanding your journey, and never losing sight of the vast expanse of information you’ve traversed. Whether you’re a professional investigator, a curious academic, or just someone who loves diving deep into the digital realm, the History Graph is your companion, ensuring every step you take is recorded, contextualized, and visualized. Welcome to the future of online research.